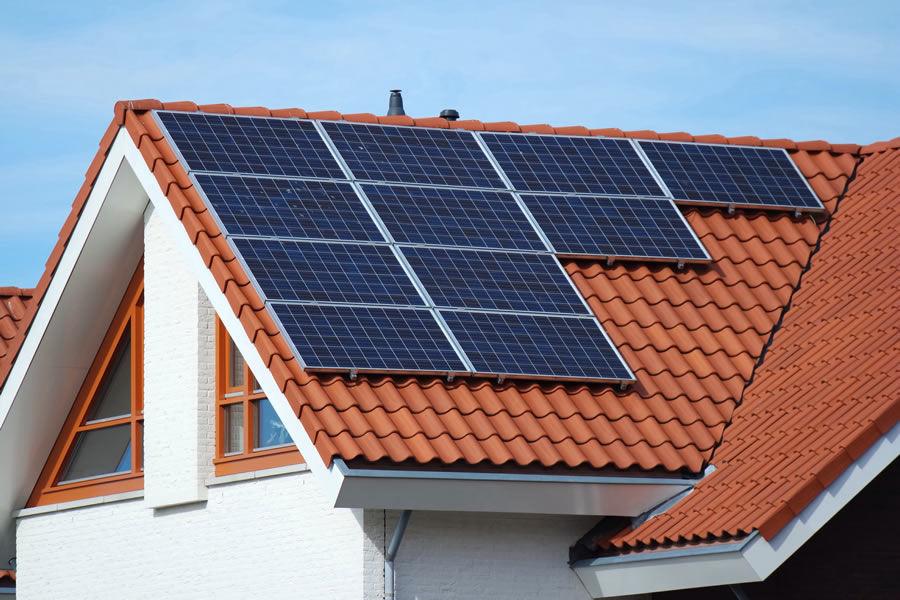
Quincey’s system with 10 Sanyo panels plus a Fronius inverter, surpassed predictions by producing 2060kWh in a year, but on-site utilisation struggled to match expectations
More than two years on from completion of his low-energy home in Devon, Richard Quincey reviews how his photovoltaic array has been performing
The house is well and truly up and running, and a very pleasant place it is to live. If classified under the Code for Sustainable Homes it would be roughly a Code 5, although it was designed and completed well before the code was announced.
BSj readers will be familiar with the property from my reports on its construction and initial performance in September 2005 and March 2007. It is essentially a biomass/solar/electric eco-home with advanced mechanical ventilation heat recovery (gas being unavailable in this rural location). It also features excellent day-light performance.
In October 2006 I had a 2.1kWp (kilowatt peak) photovoltaic grid-connected array installed, taking advantage of the 50% grant available at the time through the government’s Low Carbon Buildings Programme. The PV system, installed by Greenearth Energy, consists of:
- 10 Sanyo HIP 210 NHE1 PV panels (mono-crystalline/amorphous hybrid) – high-efficiency cell 18.7%, 16.8% module
- one Fronius IG 20 inverter
- gross generation and export metering.
The inverter technology is quite something, turning itself on and off to avoid parasitic energy use and so on. I was so impressed, it felt ungrateful to put it in the garage.
Data provided by Greenearth Energy on the solar array stated an average annual output of 1960kWh. Greenearth used PV Sol simulation software to calculate the system performance. The software uses a number of assumptions, the most interesting being the amount of energy exported to grid 650kWh providing about 77% utilisation of energy on-site.
Given current tariff arrangements for exporting micro-generated electricity generally the renewables obligation certificate value is 4.5p/kWh it is important to maximise the amount of generated electricity that is used on-site.
For the first four months, albeit during winter, the system output was monitored to determine the amount of energy utilised. This was only about 60%, with winter loads dominated by cooking and hot water top-up. This was obviously not as good as the PV Sol assumption and it was only likely to get worse as electricity production increased along with the onset of fairer weather.
Given the excellent daylighting in the house and minimal electricity use during peak production hours, we looked at ways to maximise on-site utilisation. Appliances such as washing machines and dishwashers are now operated during peak hours, with the unfortunate consequence that yours truly has the job of emptying the dishwasher.
As a result of our observations and calculations made at the beginning of February 2007, action had to be taken. Ventmiser current sensing control unit was fitted. This was adjusted to monitor the PV output and switch the PV energy (at about 400W) into a bespoke electrical immersion heater (750W) fitted in the top third of the solar hot water cylinder. This is important as the PV electricity is high-grade energy; very valuable at any time of the year when the solar thermal temperatures are insufficient to heat the house’s hot water fully. Also, with a 300-litre solar cylinder there is significant capacity to store the PV energy, attenuate its use and thus maximise on-site utilisation.
Monitoring of the exported energy for the next six months indicated a significant improvement: the amount of energy utilised on-site increased to 82%. This simple system addition seems extremely helpful while we wait for the tariff structure for micro-generated electricity to be overhauled.
We have continued to monitor the system for a full 12 months and results show an interesting problem – the school holidays. The measured annual production is 2060kWh, which is 5% above the manufacturer’s estimate. But in August, one of the best PV electricity producing months, there is a period of two to three weeks of virtually zero on-site demand. This has the net result of reducing the annual site utilisation to approximately 73%. From my experience, it seems reasonable to assume 60% utilisation without a hot water dump or about 75% utilisation with a hot water dump.
The monitoring also had interesting results regarding PVs from the marketing perspective. It suggests that the annual yield figures provided by PV suppliers are pretty good while manufacturers’ on-site utilisation figures are optimistic, especially when PVs are likely to be installed on low-energy houses with low daytime electrical baseloads.
So, the good news is that PVs work well; the bad news is, so does my house.
Acknowledgments: Philip West at West Energy Saving Technologies (Ventmiser), Dai Rees at Greenearth Energy
Source:
Building Sustainable Design

